The Full Picture for Apartment Supply
In analyzing the state of the apartment market, it is important to consider both the supply and demand dynamics. The undercurrents of the apartment market are multifaceted, and focusing solely on supply overlooks critical factors that can impact asset performance.
Current Supply and Demand
As the chart below shows, apartment supply only tells one half of the story. The demand side, measured here in terms of units absorbed (light blue bars), shows a very different narrative to the supply story in recent media reports. The last six quarters of demand falling behind net absorption followed a surge in demand for apartments beginning in the first quarter of 2021. The demand-heavy gap only increased in 2Q 2021 and persisted through the third quarter of that year. Essentially, the current situation reflects “normalization” and a re-balancing in the market following a period of intense demand.1
Subscribe now for more CONTI insights
In analyzing the state of the apartment market, it is important to consider both the supply and demand dynamics. The undercurrents of the apartment market are multifaceted, and focusing solely on supply overlooks critical factors that can impact asset performance.
The Current Supply and Demand Picture
As the chart below shows, apartment supply only tells one half of the story. The demand side, measured here in terms of units absorbed (light blue bars), shows a very different narrative to the supply story in recent media reports. The last six quarters of demand falling behind net absorption followed a surge in demand for apartments beginning in the first quarter of 2021. The demand-heavy gap only increased in 2Q 2021 and persisted through the third quarter of that year. Essentially, the current situation reflects “normalization” and a re-balancing in the market following a period of intense demand.1
Subscribe now for more CONTI insights
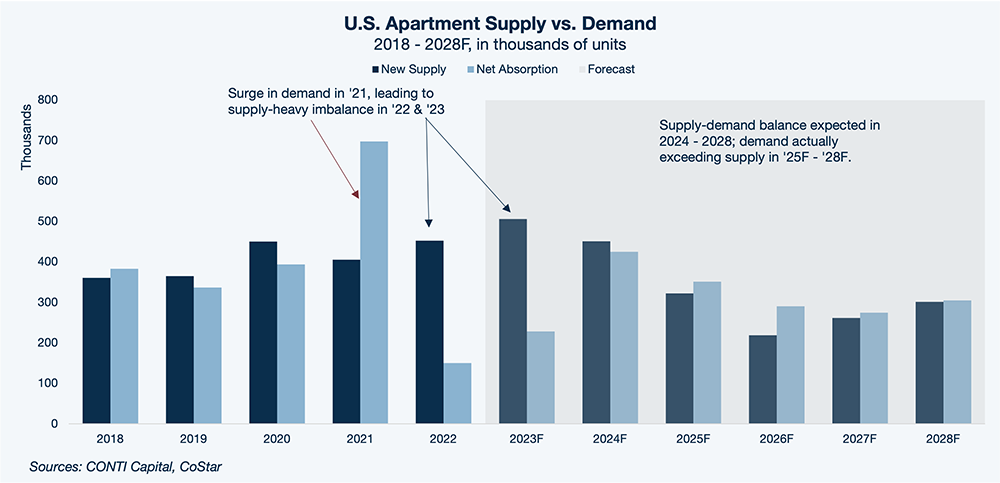
The current supply wave is a ripple effect of the pandemic. Multifamily demand experienced a substantial upswing in late 2020 fueled by a burst of household formation, and in response, developers ramped up the construction of new apartment units.2 Demand moderated in the latter half of 2022 as the economy began to normalize, but many projects initiated during the earlier growth period are set to deliver in the months ahead.3
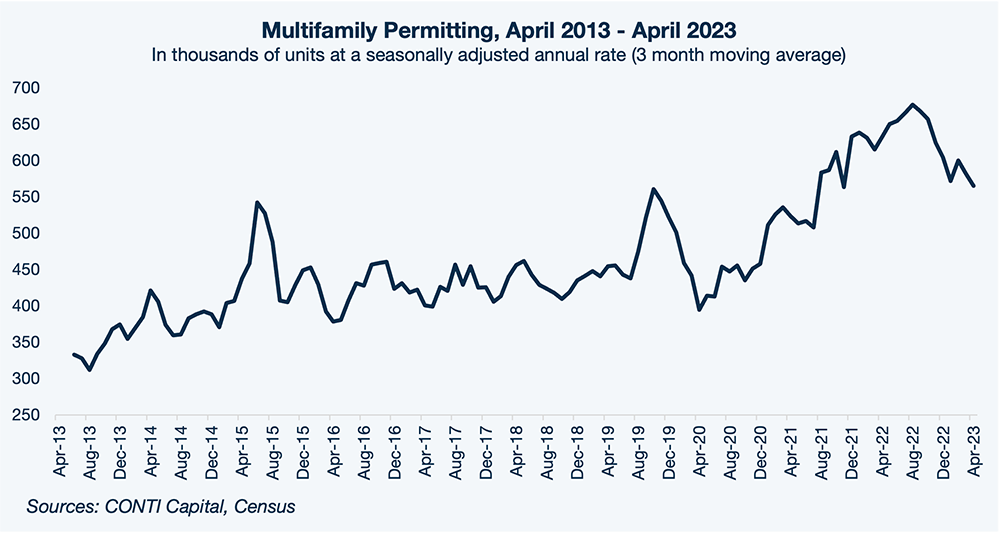
As of April 2023, 566,000 multifamily permits were reported over the previous 12 months (here shown as a three-month moving average). This is down substantially from the 677,000 units permitted during the year through August 2022—which likely represents this cycle’s peak for new permitting.
These trends will have major ramifications for the housing landscape moving forward because it can take anywhere from 2 to 4 years for new supply to move from permitting to completion.4 However, given changing development economics where the price of new construction is rising rapidly, many of these projects are likely to never start construction in the first place. This is precisely why we expect new deliveries of investment-grade multifamily properties to peak this quarter before falling to more historical levels by the first quarter of 2026.
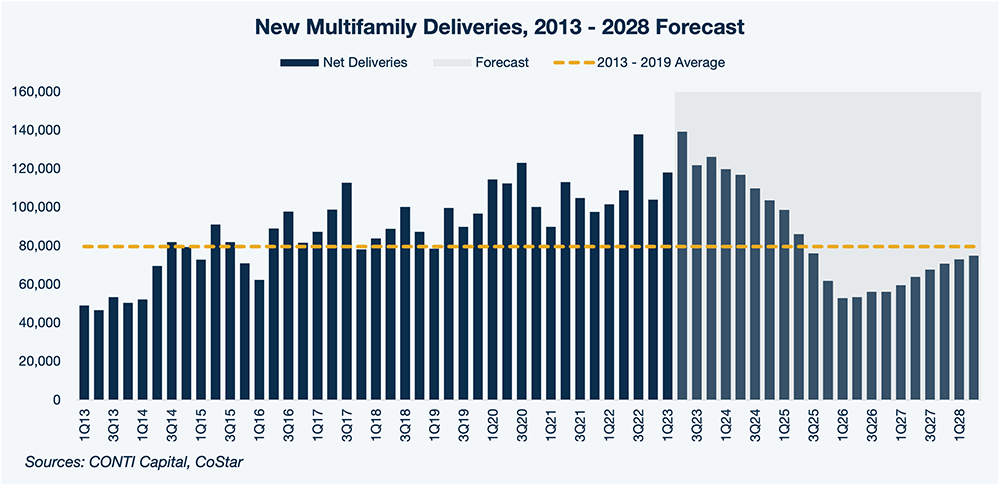
In fact, based on data from CoStar, we see new supply volumes falling below the pre-pandemic average by the third quarter of 2025. We would not be surprised if media narratives shift back to lamenting the shortfall in apartment construction by the middle of the decade.
In short, the negative impact of the supply wave on apartment fundamentals will likely only last through the short-term, based on our analysis. Meanwhile, the current supply landscape offers potentially lucrative opportunities for investors. For one, we have seen that multifamily properties today can be acquired at a significant discount to replacement cost due to rising construction costs. In addition, for investments in which the hold period is relatively short—say, three to five years—there is the potential to exit the investment during a time when new supply is at its lowest in over a decade.
In addition to these broad trends, there are a few other factors we think investors should consider as it relates to new supply:
Market Data Obscures Substantial Variation Across Zip Codes
Metro areas are large and diverse, and in our view, it makes little sense to draw broad conclusions based on metro-level data. Urban areas are bearing the brunt of the surplus in many places, while pockets of unmet or under-met demand still exist in zip codes just off from the city center and in more suburban locales.
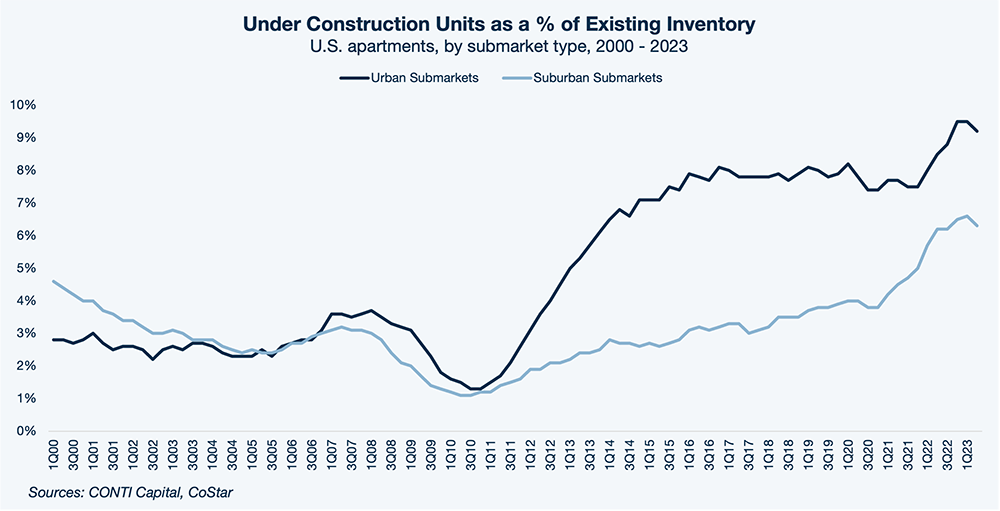
In our experience, supply competition is a hyperlocal phenomenon, which means that multifamily asset performance can differ drastically from one zip code to the next—which is why we use our proprietary data modelling tool, the CONTI Index, to evaluate potential acquisitions using zip-code level data.
Significant Financial Barriers to New Construction
The series of bank failures starting with Silicon Valley Bank in March has catalyzed a tightening of lending standards across regional banks, making it more difficult for developers to get the loans they need to get shovels in the ground.5 Even prior to recent bank failures, though, construction has been running up against significantly higher prices for materials and labor through this recent bout of inflation – and these prices are expected to remain elevated through at least 2025.6 All told, we expect these financial barriers to weigh significantly on future CRE construction in our short-term outlook.
These challenges to new construction are also creating an environment in which we are able to discover certain deals at a discount to replacement cost. That is, apartment properties that completed construction in early 2022, for example, were built at a lower cost than if a developer tried to build an identical property today. This puts the owner of that property at a competitive advantage, since any new supply delivered now will likely have to set rents significantly higher in order to achieve a similar return.
New Supply Still Doesn’t Adequately Meet Long-Term Housing Needs
The U.S. is still caught in a decades-long housing shortage – current estimates suggest about 2.3 million more housing units are needed to fill the supply gap.7 In order to meet that, housing construction would need to increase by 50%, which is unlikely, given the supply barriers described above.
Sun Belt In-Migration and Job Market Indicators Remain Robust
Despite the current market circumstances, we see no indication that demand within our target Sun Belt markets should slip by any significant measure in the long term.8 People continue to move to these metros at higher rates than Gateway markets, drawn by high levels of job creation.
The Bottom Line
Apartment supply is only half the story. Sun Belt markets still benefit from solid demand fundamentals, and our analysis tells us we can likely expect a greater demand push within our forecast period.
SOURCES
1 For more on this point, please see The CONTI Report, 1Q 2023
2 U.S. Census April 2023, Yardi Matrix May 2023, CoStar June 2023
3 RealPage, data through June 2023
4 Based on an analysis of Census data through year-end 2022 and CoStar property level data, in addition to conversations with market participants.
5 https://www.multifamilydive.com/news/multifamily-finance-apartment-construction-starts/649487/
6 https://www.constructiondive.com/news/falling-material-prices-expected-reverse-course/651744/
7 Realtor.com analysis of construction and demographic data through year-end 2022
8 CONTI Capital analysis of Oxford Economics data as of June 2023


